
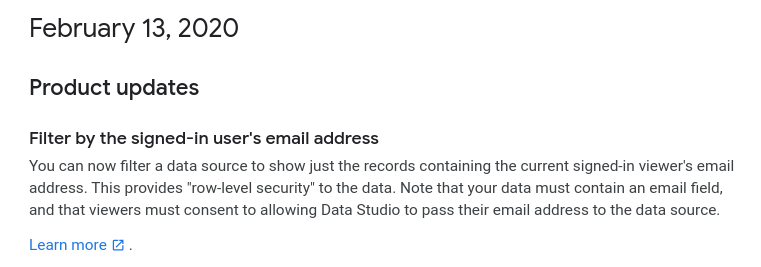
Advanced filter by email in Google Data Studio

Row-level security for Google Data Studio was announced earlier this year (February 13th, to be precise). This feature, a true game-changer in my opinion, allows the records of any data source that contains an email field to be automatically filtered in accordance with the email of the logged-in user that is viewing the report... provided that he is using a Google (Gmail or G Suite) account, that is.
This rather straightforward feature is thoroughly explained in Data Studio's Help Center. Besides that, some #dataviz experts have written detailed tutorials and walkthroughs, e.g. this excellent one by Michael Howe-Ely, to mention but a few.
I said before that this filter by email capability is a game-changer. And the reason for that has to do with the fact that it provides an incredibly immediate way to deliver the right information, to the right people, using a great (neat, interactive, #nocode) web user interface.
Until now, some rather convoluted hacks had to be put into place to create personalized reports. These smart hacks frequently involved mangling filtered report's URLs, using transparent shapes to lock filter controls, and some other sorceries required to summon the right amount of data privacy. If you don't believe me, have a look at this (extraordinary) advanced tutorial on Data Studio embedding by Stéphane Hamel.
If your use case fits inside a Google - centric environment, this is now easy-peasy. You can use Data Studio to power corporate intranets that show private, for your eyes only, personal information, such as but not limited to:
- Requested work permits.
- Periodic personal performance assessment results.
- Internal training courses attended.
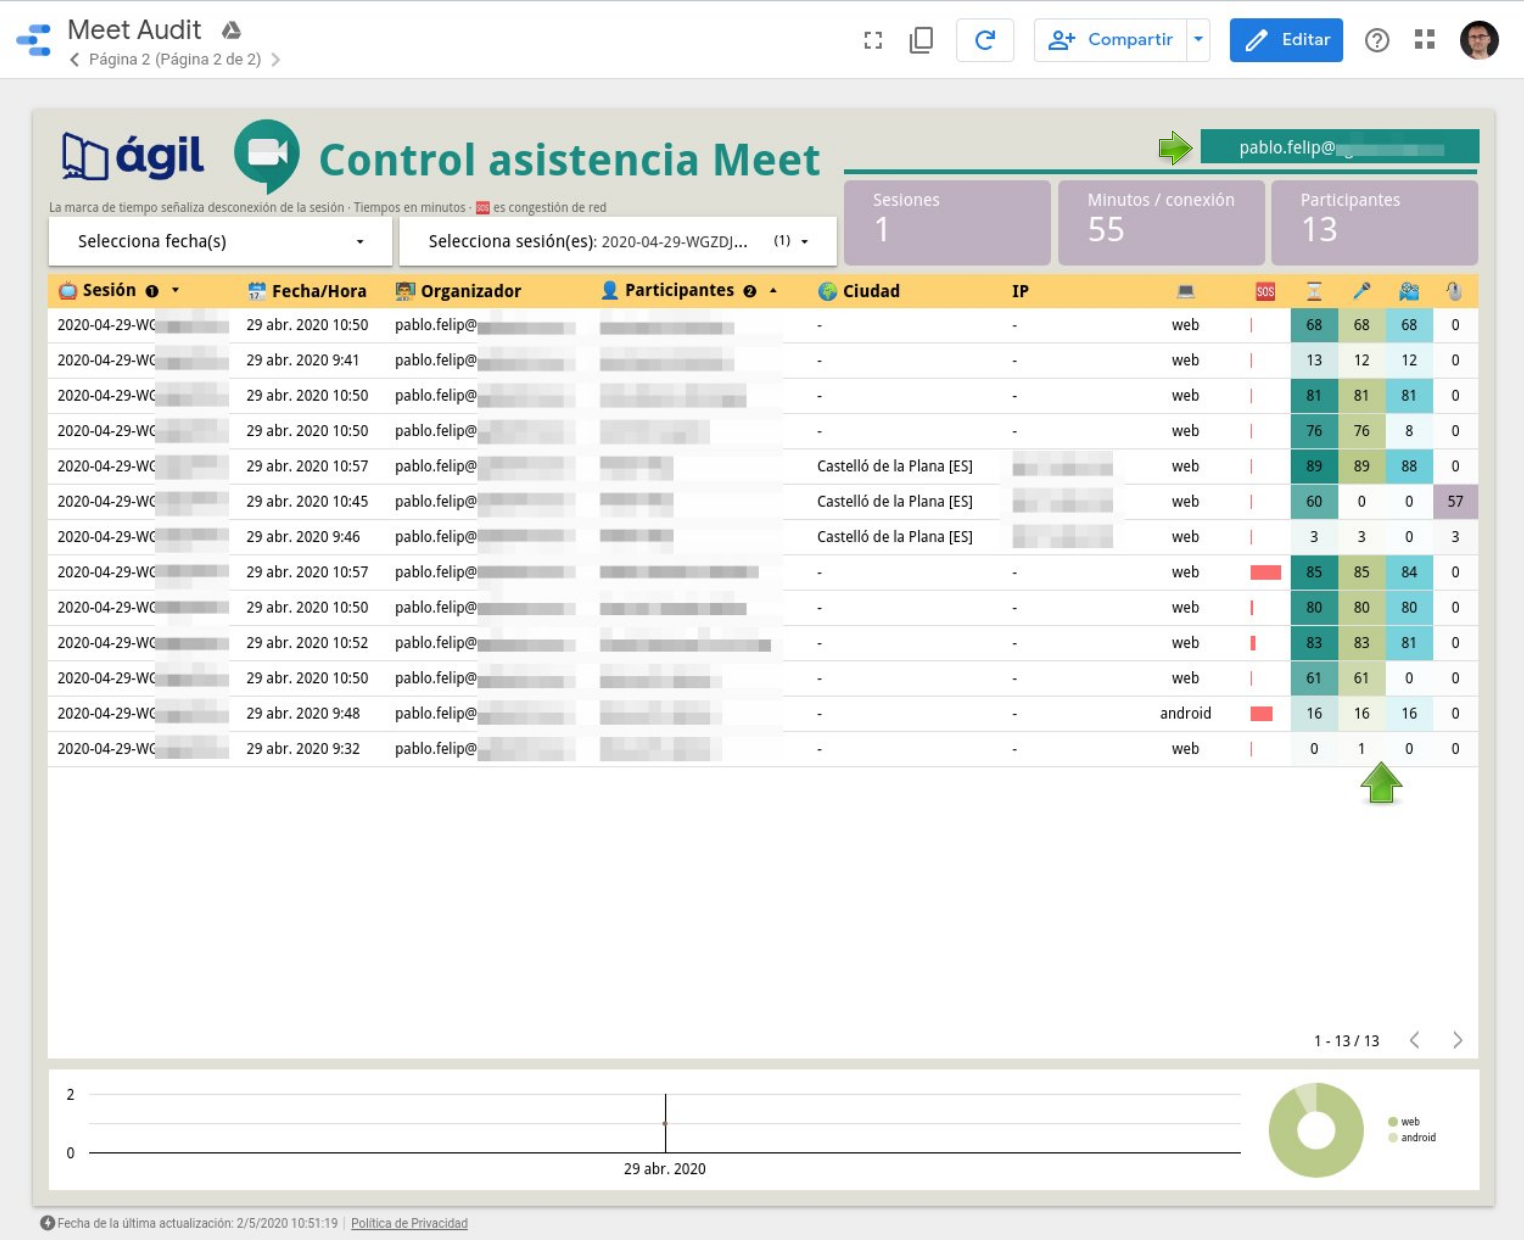
- Online meetings stats, as in this report that I recently built for the teachers of my school, with the aid of some additional Apps Script to fetch data from the innards of G Suite's Admin SDK Reports API.
Client-side HTML / JS / CSS Apps Script web apps are no longer needed for any of this. Well, not always, at least. Game-changing at its best, don't you feel?
But we can go one (or two) steps further.
Let's recap: Row-level security requires that a specific dimension inside any given data source be interpreted as an email that, by the way, needs exactly the same capitalization as the logged-in user's email. So, apparently, this dimension has to be present in any data set / source that should filter by email (user) in our report, isn't it?
And that leads us to this second issue: What if some records had to be accessible for a group of users? For instance, department monthly turnover, relevant to head of department, CFO, COO, CEO, etc. With just a text dimension vs single email match, this does not seem feasible at all.
Fortunately, the answer to both questions lies in data blending.
Please, do follow me along with this simple example. Let's begin at the data set level, a humble Google spreadsheet that stores some random revenues (Revenue tab) and activities (Activities tab) for different organizations / company departments (whatever):
Notice that none of both tables has an email field. But head now to the third tab (Security) and find there some email / org pairs. This will be our master security table. Essentially, we are assigning users to organizations, thus stating who should have access to which organization's data.
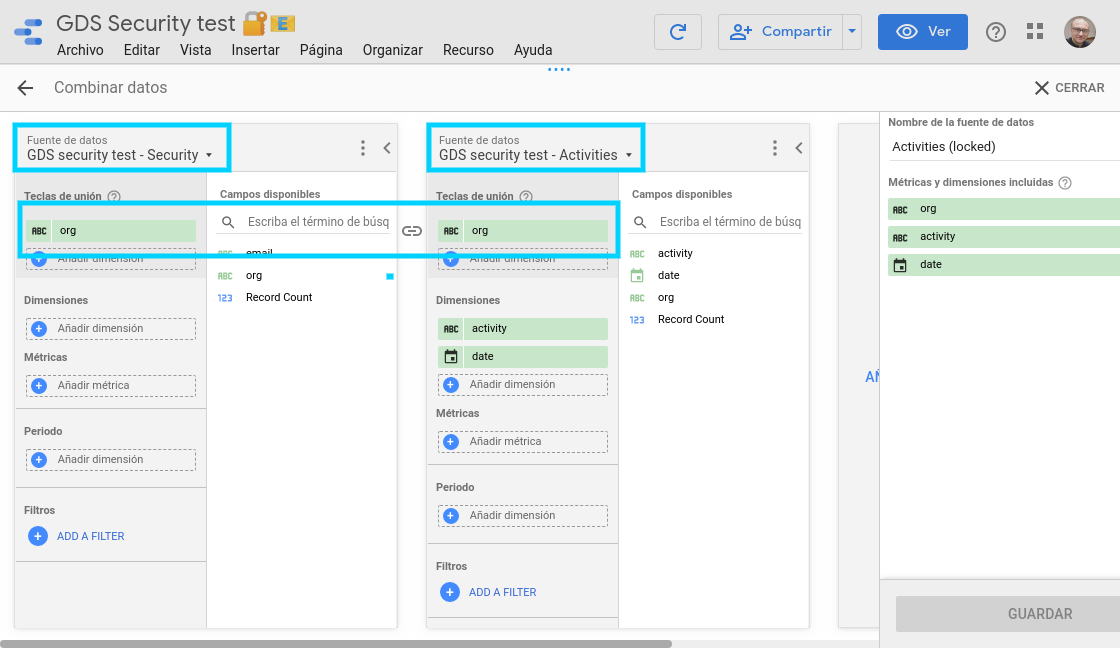
Let's move on to the corresponding Data Studio report, where we have created three data sources for those three former data sets:
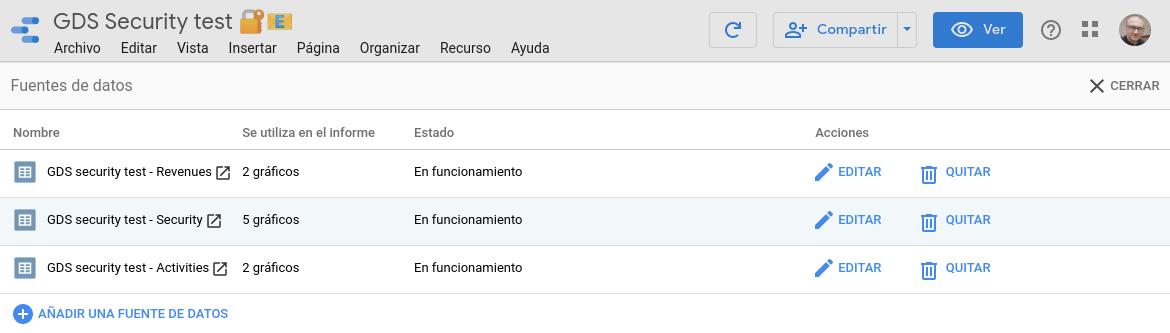
We activate email filtering only on this one 👉 GDS security test - Security.
Now it is prime time for data blending. We'll create the following two blended views using org dimension as key:
- Security x Activities.
- Security x Revenues.
Remember that blending in Data Studio is a left outer join combination. So, the data set that contains security (visibility) information does come first in both views.
⚠️ If you are somewhat new to data blending, please read this article first and then proceed to behold the subtleties of left outer joins carefully examining this data blending cheat sheet by Simon Breton. Nulls and duplicates do happen!
Let's take a glance now at one of our blended views. The other one is analogous.
Now let's see how this all fits in the actual, final report:
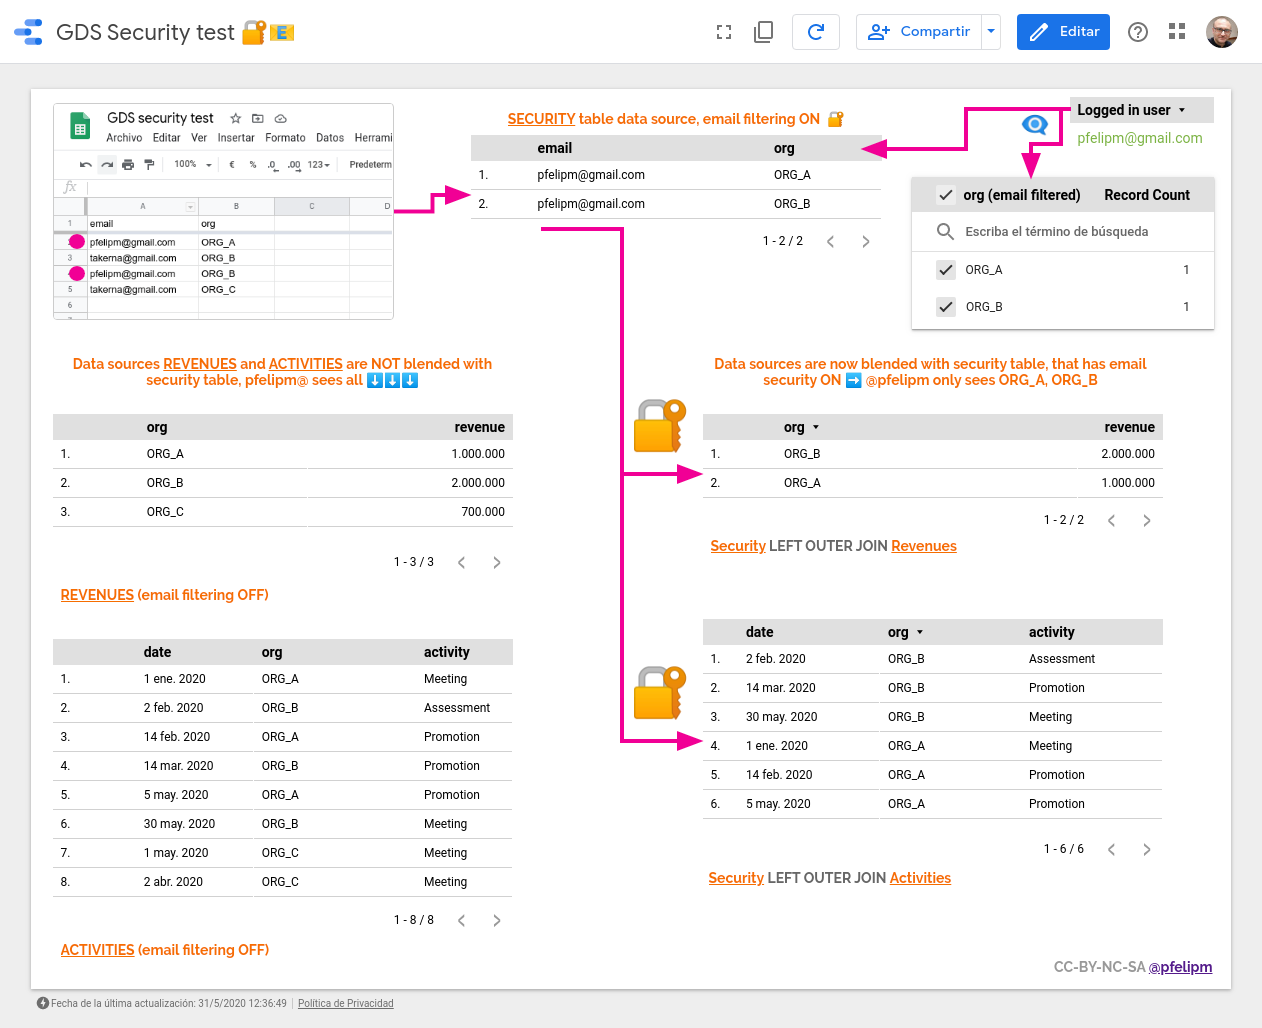
Notice that both tables on the right side of the report (revenues and activities) are fed by our two blended views. The left part of both combinations is our email-filtered data source (security), that binds emails (users) with the organizations over which they should have view rights.
ℹ️ Logged-in user (pfelipm@) sees both ORG_A and ORG_B data, as intended. User takerna@ (although not shown), would access org's B and C. Notice that both users can view ORG_B's information. This would not have been possible using just simple email filtering with no data blending, unless we had duplicated some records, which in my view is simply not acceptable.
Here you can find the spreadsheet, data sources, and the report used in this post:
- Spreadsheet (data set).
- Security | Revenues | Activities (data sources).
- GDS Security test (report).
To conclude, I feel this strategy greatly increases the power of email filtering in Google Data Studio. What do you think about it?
Comentarios